As forecasters predict a particularly active hurricane season for 2021, state departments of transportation from Texas to New Jersey are preparing for worst-case scenarios to help citizens get out of town if a big storm ends up heading their way.
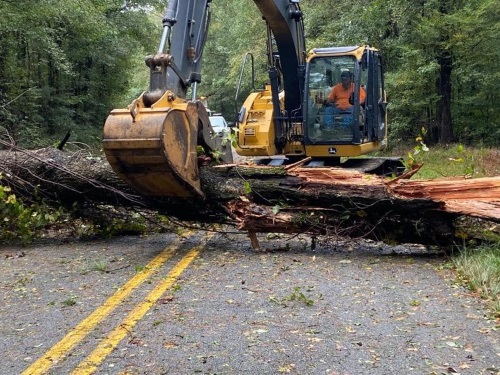
[Above photo by the Louisiana DOTD]
The Atlantic hurricane season began on June 1 and lasts through November 30. The National Oceanic and Atmospheric Administration’s Climate Prediction Center predicts a “likely range” of six to 10 hurricanes with winds of at least 74 miles-per-hour to form this year, with three to five major hurricanes with wind speeds of at least 111 mph developing as well.
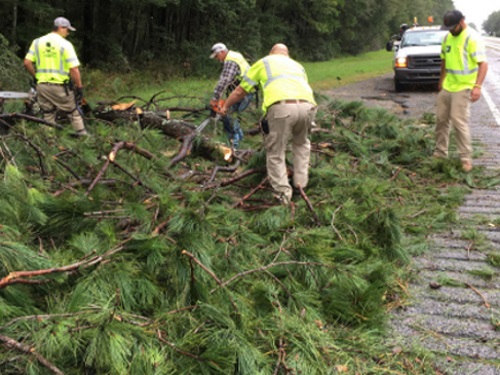
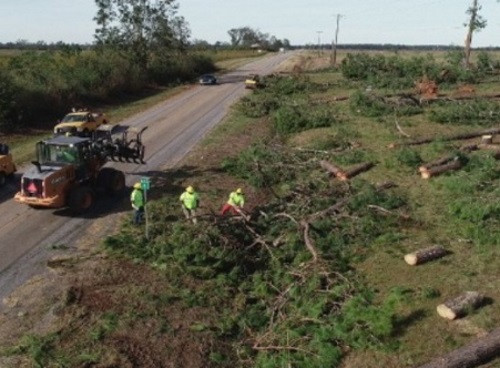
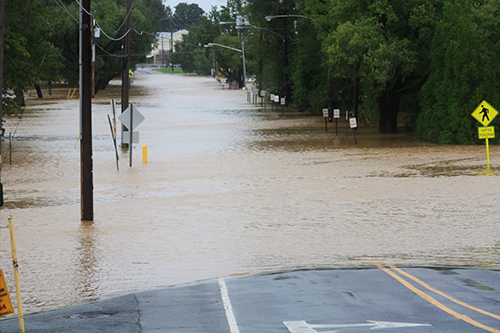
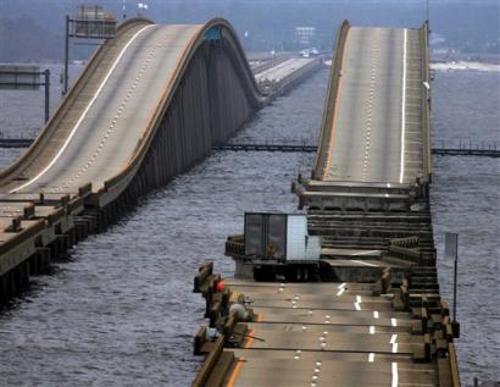
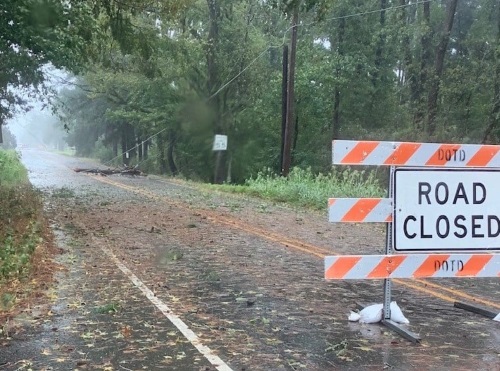
Even relatively “minor” hurricanes can cause significant damage, especially to transportation systems, as the impact of Hurricane Sally – which struck the Alabama and Florida border in September 2020 – demonstrates.
Five hurricanes made landfall in Louisiana in 2020, prompting evacuations ahead of the storms and road closures in their aftermaths. To ensure quick evacuation of citizens from low-lying, flood-prone areas ahead of such storms, the Louisiana Department of Transportation and Development has a longstanding partnership with the Mississippi Department of Transportation to activate contraflow operations for removing people from New Orleans and coastal areas rapidly.
“The pinnacle of our cooperative efforts come out during an emergency evacuation,” Louisiana DOTD Secretary Shawn Wilson explained. “This region has a very cooperative history. We were in Beaumont (Texas) last year after one of the hurricanes, and we brought in personnel from the Tennessee DOT to help us. We all help each other as the circumstances warrant.”
When activated, the Southeast Louisiana Evacuation Plan calls for the Louisiana DOTD and Louisiana State Police to reverse traffic on the southbound lanes on Interstates 55 and 59. Once traffic reaches the Mississippi state line, the Mississippi DOT takes over traffic control and guides the combined eight lanes of traffic well into the heart of Mississippi.
The Mississippi DOT held a contraflow drill on June 3 to practice moving equipment into place and communicating with each other along the 86 combined miles of “contraflowed” interstate lanes.
“We go through all the motions except actually closing the exits on the interstates,” said Jas Smith, Mississippi DOT’s communications director. “The intention is to quickly evacuate the New Orleans and coastal residents. We want to get them out as quickly as possible.”
The Alabama Department of Transportation also has an interstate contraflow plan ready to go during daylight hours, according to Tony Harris, the agency’s media and community relations bureau chief.
“We only contraflow Interstate 65, north of Mobile, to Montgomery,” Harris explained. “We have a deployment rehearsal where we do everything but stop traffic. It’s like a military operation with about 120 defined steps and procedures.”
The South Carolina Department of Transportation recently released an animated video that explains how its intrastate contraflow works on Interstate 26 from Charleston to Columbia.
Meanwhile, the Florida Department of Transportation recently added several new features to its 511 site along with a new mobile application to assist motorists during hurricane evacuations.
States even as far north as New Jersey are holding evacuation drills “to practice and refine response activities in the event of a major hurricane,” according to a news release from the New Jersey Department of Transportation. “This annual drill is to practice a worst-case scenario in which New Jersey shore communities would need to be evacuated in a short period of time due to a hurricane or other natural disaster,” noted Diane Gutierrez-Scaccetti, the New Jersey DOT’s commissioner. “This gives crews from the New Jersey DOT, the New Jersey Turnpike Authority, and the South Jersey Transit Authority, along with the State Police, an opportunity to test our plans and make sure our emergency personnel are able to quickly and efficiently get people out of harm’s way.”