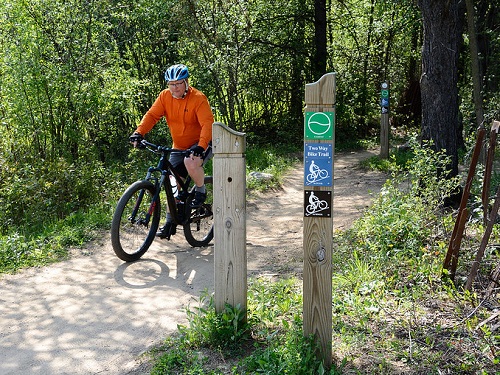
Could “happiness” become a Key Performance Indicator or KPI tracked by state departments of transportation very soon?
[Above photo by the Minnesota DOT]
Dr. Yingling Fan, professor of urban and regional planning at the University of Minnesota’s Humphrey School of Public Affairs, believes it is inevitable that state DOTs across the country will eventually benchmark “happiness of the people” for whom they build infrastructure as a KPI, right up there with on-time, on-budget, and safety metrics.
“Traditionally in transportation, it’s always been about getting you from Point A to Point B quicker,” Dr. Fan explained in an interview with the ETAP Newsletter. “And when you over-emphasize efficiency, you kind of minimize the human experience. So, I would say happiness should be a new performance measure for our transportation systems where we can maximize the human experience.”
Fan has tested this idea with a pilot program in Minneapolis-St. Paul, where she developed a Transportation Happiness Map. A GPS-based mobile application captured commuters’ routes and their transportation modes (car, bus, bike, rail, or walking). After the commute, they were asked which emotions they experienced on the trip, including happy, meaningful, painted, sad, tired, or stressed.
The study concluded that people commuting along a scenic riverside route were the happiest with their commute, while bicycling won out as the happiest mode of transport.
Traditionally, biking and walking have been considered “inferior modes” by transportation officials because they are slower means of travel, Dr. Fan said. But that type of analysis does not factor that “the biking and the walking are happier than the driving.”
“We know that our built environment can affect our emotions,” Dr. Fan explained. “So, from an urban planner and a transportation engineer perspective, I feel like there is a responsibility for us to understand the impact of our infrastructure on people’s emotions.”
Dr. Fan pointed out that public transit agencies routinely measure its customers’ levels of satisfaction, which Fan argues is really a measure of how happy the service makes the customer. “They don’t call it happiness, but it’s a pretty close concept, right?”
Dr. Fan has found a willing partner in the Minnesota Department of Transportation, where Nissa Tupper is the director of transportation and public health planning. Although Tupper did not participate in the happiness map project, she did appear in a documentary about Dr. Fan’s work and is an enthusiastic supporter of the research.
“I think that focus on emotional experience is new for most of us in transportation,” Tupper said. “We talk about levels of service and modes, but people talk about picking up their kids from daycare and not driving over potholes,”
It may take some convincing to get some state DOTs to measure something as subjective as people’s happiness, but Tupper said the research is showing “a lot of promise” and should be taken seriously.
“Yes, we need measures to understand how we’re doing,” Tupper said. “We also need the flexibility not to quantify everything all the time.”
Dr. Fan believes the research she and others are doing on happiness eventually could be incorporated into the National Environmental Policy Act or NEPA process. “If you look at the current shifts in the transportation industry, previously, we didn’t even count the pedestrian traffic as traffic,” Dr. Fan said. “Now, there is this movement, this momentum, to recognize the benefits of those greener transportation modes, and I hope that happiness could be one of the benefits associated with it.”


